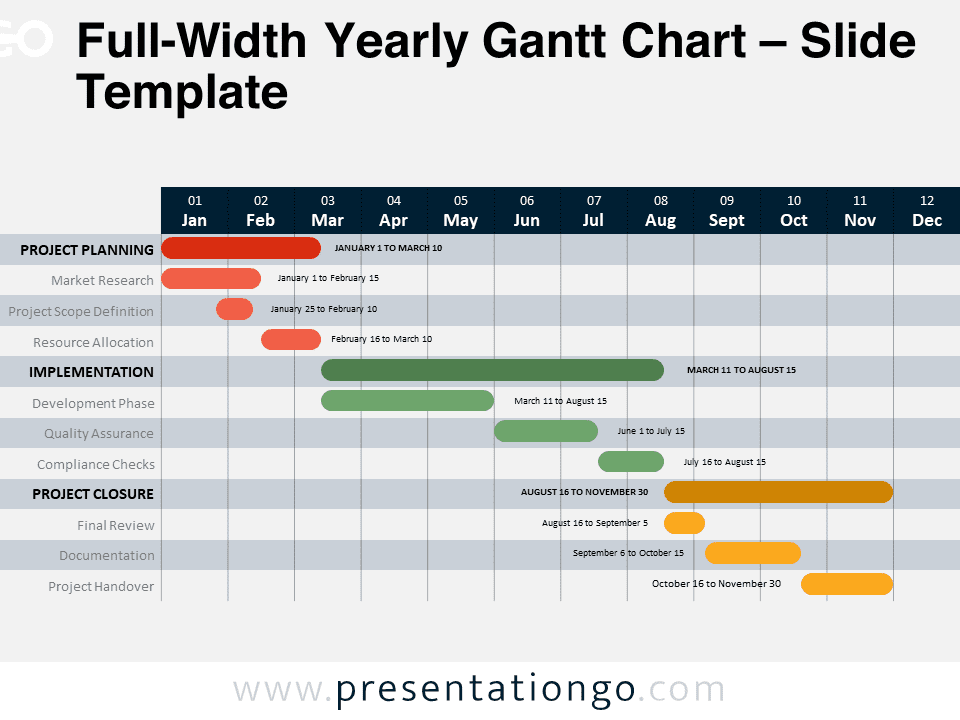
The Event Planning Gantt Chart provides a comprehensive 8-step timeline visualization that tracks project tasks across weekly intervals, designed specifically for PowerPoint and Google Slides presentations.
Organize Milestones and Manage Deadlines Visually
This diagram features a clear table structure with eight horizontal task rows and eight vertical weekly columns. Each task is visualized through a horizontal bar comprised of color-coded cells, effectively showcasing both duration and scheduling. The five-color scheme highlights different task types, from planning to execution and closure. The chart uses solid fill bars to define project phases, improving readability while helping presenters distinguish between stages at a glance.
Gantt charts serve as one of the most reliable methods to display project timelines and task relationships. In presentation settings, they illustrate sequencing, duration, and overlap in a format that’s easy to interpret. This specific chart is ideal for managing events but also adapts well to campaign rollouts, product launches, or internal projects. For example, an event manager could track speaker invitations and logistics, while a marketing lead could visualize promotional efforts alongside budget approvals.
The file includes two unique slides, light and dark themes. Built using editable tables, it allows complete customization. Users can change colors, rename tasks, or adjust timelines to suit any context. Available in both 4:3 and 16:9 formats, it’s compatible with PowerPoint and Google Slides.
Download this 8-task, 8-week Gantt chart to simplify your project timeline and track event planning with clarity and ease.
Widescreen (16:9) size preview:

")
This template offers:
- 2 unique slides
- Options for both light and dark themes
- Created with the Table feature – Fully customizable for complete control
- Available in both Standard (4:3) and Widescreen (16:9) ratios
- Offered in both PowerPoint PPTX and Google Slides formats